
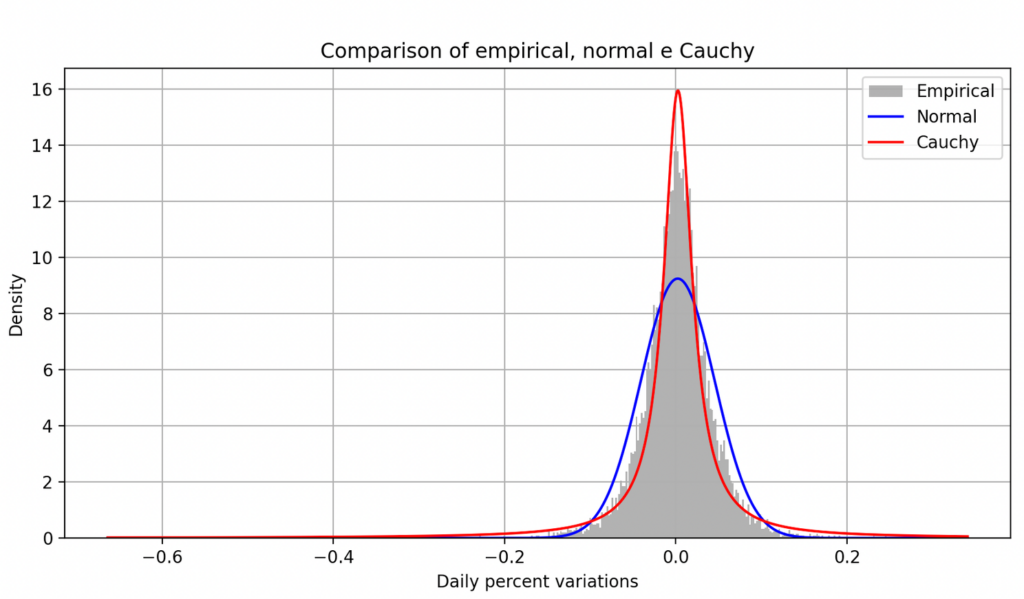
Some years back I received a gift from a friend (Antonio), a game-changing book “The (Mis)Behavior of Markets: A Fractal View of Risk, Ruin, and Reward”. In 2004 Mandelbrot introduced a new theory about the market movements suggesting that it is much more chaotic than what described by the classical theory. He showed that extreme price movements (crashes, booms) occur much more often than expected, thus suggesting that the long-tails of price movements are fatter than expected and markets are riskier than the used models can predict (including the most recent ones based on AI and ML). The two implications I have identified clearly, the former is that the Black-Scholes model is not suitable for options pricing as its assumption is that asset returns follow a normal distribution, while a distribution with fat tails is closer to the cauchy distribution. New fractal models have then been introduced under the assumption of the self similarity prices variation at different scale, based on volatility or, how I use to say, the energy of the system. It is curious to me that to some extent, the contents of the book, in some way, predicted the crash of 2008. The latter is that more attention should be paid to extreme cases as they occur more frequently than expected.
For first point, I wanted to verify the price distribution of three real underlyings, AAPL, BRK-A and IBM and their daily price variations over the last 42 years. You may notice that they follow a distribution more similar to Cauchy than to a Gaussian.
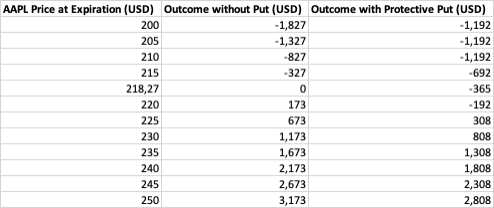
One of the most common suggested techniques by professional traders is to cover by buying a put option for every 100 owned stocks. Using AAPL stock again, as a reference, if a private investor owns 100 shares of Apple (AAPL) purchased at $218.27 each (as of close on last Friday), to protect the investment against potential declines, he/she decides to buy a put option with a strike price of $210 and an expiration in one month (priced at 3,65$). The cost of this option, known as the premium, varies based on factors like volatility and time until expiration, that is he/she has one month time to exercise the option, that is can profit both from an excessive drop and from a rise in price. If the price remains the same for one month, the loss is the option price that is 365$. Of course if the purchased put options are 3, at 200$ or the price is reached in an extremely volatile market, the value is not linear and the gain might be more consistent, covering the loss or even make the overall trade profitable. Last obvious consideration, when exercising the option in a positive ground, should close the long operation on the underlying as well to avoid a loss.
And now we come to the backtest simulation we anticipated in last article, that is reported in the following video. I have hypothesized two thresholds from open +3xσ and -3xσ (under the assumption the distribution of the previous days is normal even if we’ve understood it’s not) and that the trade is a buy when traversing the +3xσ and sell when traversing the -3xσ. If the price rebounds, in order to avoid losses, the trade operation is closed at the same price, otherwise at close. In two years it would have implied 389 operations and 13,4% gain on $100K if the trading commission is fixed and stop limit orders are executed perfectly (for lower capital the risk of impact of spread b/a is too high). You also need a perfect automated trading system to do that. As usual, it’s a matter of acceptable or not acceptable risk/reward ratio.
Considering that it’s not easy to gather historical price of options as the price is dependent from strike price, current price but also from volatility, assuming instead there is no overprice due to volatility (and the current market is extremely volatile), the dynamic P/L is shown in the following figure.
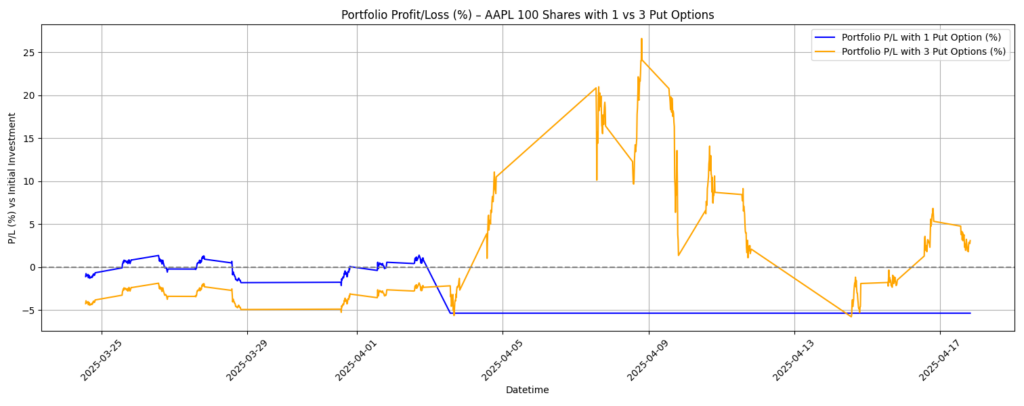
To make the long story short, looking at the graphs, in both cases (buying 1 PUT or 3 PUT) with a risk lower than 5% at any time, you could easily gain more than 20% in two weeks time, not considering the volatility component that would raise that value a lot.
Given that acceptable risk/reward is absolutely subjective – didn’t ever manage to get a response to the question: “what is an acceptable risk/reward ratio?” – up to the reader to evaluate if it is a good and safe trading strategy.